Industry Adaptation
One intelligence foundation. Industry-specific understanding.
The architecture is horizontal; the operating reality is not. Blue River Labs is designed to preserve a common intelligence foundation while adapting the ontology, integrations, workflows, governance, and evaluation model to each domain.
Adaptation model
- Ontology
- Integrations
- Workflows
- Controls
Common horizontal foundation
Canonical graph, prediction, grounded reasoning, governed execution
Evaluation criteria are defined per domain.
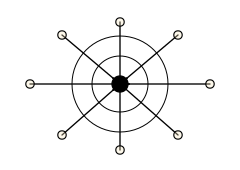
What stays constant—and what changes.
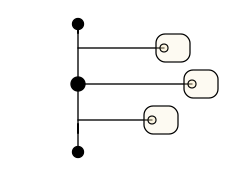
Common Foundation
- Connect fragmented systems
- Resolve canonical entities
- Model relationships and time
- Predict likely outcomes
- Reason over constraints
- Govern action
- Capture human decisions
- Learn continuously
Industry Adaptation
- Domain ontology
- Source-system connectors
- Predictive tasks
- Workflow episodes
- Interface and vocabulary
- Compliance and approval rules
- Evaluation metrics
- Operational feedback loops
Designed for
Eight domains, one foundation.
Each grouping below describes what the graph is designed to understand and the workflows it is designed to support. These are potential applications of the platform, not current deployments.
Software Engineering
What the graph understands: Services, repositories, APIs, schemas, tickets, incidents, deployments, teams, dependencies, and engineering decisions.
Potential workflows: Architecture Q&A, design documents, blast-radius analysis, incident triage, review, testing, migration, rollout, and release intelligence.
Designed for domain ontology, source-system integrations, approval controls, and domain evaluation criteria.
Manufacturing and Automotive
What the graph understands: Assets, parts, suppliers, production steps, maintenance, quality events, engineering changes, plants, and customer commitments.
Potential workflows: Change-impact analysis, predictive maintenance, supplier risk, quality investigation, production exception management, and cross-plant learning.
Designed for domain ontology, source-system integrations, approval controls, and domain evaluation criteria.
Healthcare and Pharmaceuticals
What the graph understands: Research, operational processes, quality documentation, manufacturing, supply, policies, controls, approvals, and regulated evidence.
Potential workflows: Governed knowledge access, evidence traceability, deviation investigation, process support, risk analysis, and cross-system decision provenance.
Designed for domain ontology, source-system integrations, approval controls, and domain evaluation criteria.
Banking and Insurance
What the graph understands: Products, policies, customer operations, risk controls, legacy systems, incidents, approvals, transactions, and organizational ownership.
Potential workflows: Change-impact analysis, control traceability, operational-risk investigation, service recovery, policy reasoning, and governed workflow assistance.
Designed for domain ontology, source-system integrations, approval controls, and domain evaluation criteria.
Government and Defense
What the graph understands: Programs, systems, requirements, vendors, approvals, operational events, mission constraints, responsibilities, and dependencies.
Potential workflows: Permission-aware knowledge access, dependency analysis, program coordination, decision provenance, operational planning, and auditable assistance.
Designed for domain ontology, source-system integrations, approval controls, and domain evaluation criteria.
Energy, Infrastructure, and Data Centers
What the graph understands: Assets, designs, contractors, equipment, maintenance, capacity, schedules, commissioning, telemetry, incidents, suppliers, and operating procedures.
Potential workflows: Reliability planning, outage and incident analysis, maintenance prioritization, construction and change impact, commissioning coordination, and capacity-risk reasoning.
Designed for domain ontology, source-system integrations, approval controls, and domain evaluation criteria.
Agriculture and Fresh Food
What the graph understands: Products, origins, suppliers, substitutions, recipes, stores, inventory states, shelf life, demand, waste, and physical outcomes.
Potential workflows: Ordering, replenishment, markdown and transfer, sourcing, disruption response, store execution, preparation planning, and waste reduction.
Designed for domain ontology, source-system integrations, approval controls, and domain evaluation criteria.
Chemicals, Textiles, and Industrial Supply Chains
What the graph understands: Materials, formulations, batches, production steps, quality, suppliers, logistics, equipment, customer specifications, and compliance records.
Potential workflows: Traceability, batch-impact analysis, planning, exception management, supplier-risk assessment, quality investigation, and operational coordination.
Designed for domain ontology, source-system integrations, approval controls, and domain evaluation criteria.